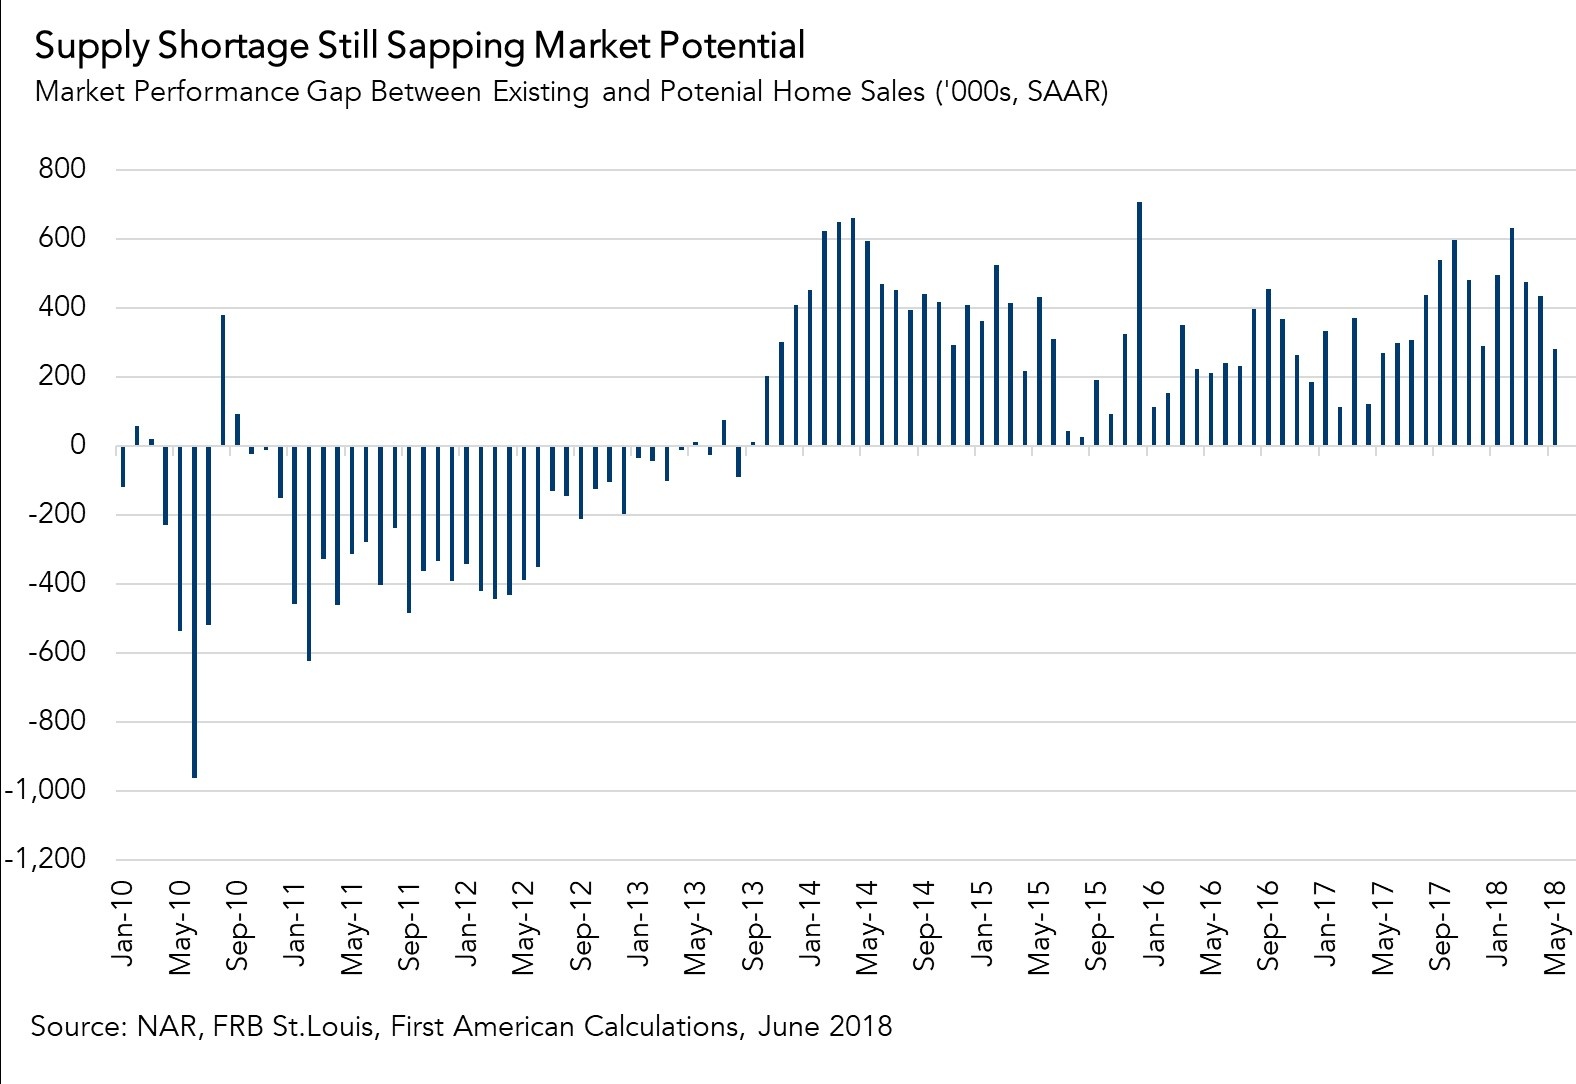
In June, the housing market continued to underperform its potential. Actual existing home sales are 4.2 percent below the market potential for home sales, according to our Potential Home Sales model, which estimates the expected level of existing-home sales based on market fundamentals. The market for existing-home sales is underperforming its potential by an estimated 256,000 sales at a seasonally adjusted annualized rate (SAAR) and has underperformed its potential for 58 consecutive months.
"The housing market is not plagued by a decline in demand, but rather a shortage of supply.”
The lack of housing supply is the primary culprit for the persisting gap. The inventory of homes for sale in most markets remains historically tight, yet demand continues to rise as millennials further age into homeownership, as explained in our Homeownership Progress Index. The housing market is not plagued by a decline in demand, but rather a shortage of supply. The result -- surging house prices.
As house prices rise and homeowner equity reaches its highest level on record, it’s reasonable to expect more homeowners to list their homes for sale and leverage their equity for a new home. So, why are existing homeowners not selling their homes?
Rate Locked and Imprisoned
Many existing homeowners today are ‘rate-locked.’ The majority of existing homeowners have mortgages with historically low rates and, now that rates are rising, they are hesitant to sell their homes. If they sell and purchase a new home, they will have a higher mortgage rate. There is limited incentive to sell when, due to higher mortgage rates, it will cost you more each month just to borrow the same amount from the bank. As mortgage rates rise further, more existing homeowners may become rate-locked into their existing homes.
Additionally, existing homeowners are facing a ‘prisoners dilemma.’ Many homeowners may want to sell their home and buy another, but do not, for fear that they will not be able to find a home to buy, which prevents more supply from reaching the market and further exacerbates the lack of inventory. Because many homeowners are increasingly rate locked-in and fear not being able to find something to buy, their home is becoming their prison.
Build It and They Will Come
One solution is to build more new homes and increase the overall stock of housing units, but the number of new homes constructed per household is at its lowest level in 60 years of record-keeping, according to the Federal Reserve Bank of Kansas City. If existing homeowners won’t supply their homes for sale then increasing the pace of new home construction, is necessary to alleviate the supply shortage in the long run. However, existing homeowners will need to start selling their homes to provide any immediate supply relief to the market.
June 2018 Potential Home Sales
For the month of June, First American updated its proprietary Potential Home Sales model to show that:
- Potential existing-home sales increased to a 6.12 million seasonally adjusted annualized rate (SAAR), a 1.1 percent month-over-month increase.
- This represents a 63.8 percent increase from the market potential low point reached in February 2011.
- The market potential for existing-home sales increased by 3.3 percent compared with a year ago, a gain of 194,100 (SAAR) sales.
- Currently, potential existing-home sales is 1.17 million (SAAR), or 16.1 percent below the pre-recession peak of market potential, which occurred in July 2005.
Market Performance Gap
- The market for existing-home sales is underperforming its potential by 4.2 percent or an estimated 256,000 (SAAR) sales.
- The market performance gap decreased by an estimated 26,000 (SAAR) sales between May 2018 and June 2018.
What Insight Does the Potential Home Sales Model Reveal?
When considering the right time to buy or sell a home, an important factor in the decision should be the market’s overall health, which is largely a function of supply and demand. Knowing how close the market is to a healthy level of activity can help consumers determine if it is a good time to buy or sell, and what might happen to the market in the future. That is difficult to assess when looking at the number of homes sold at a particular point in time without understanding the health of the market at that time. Historical context is critically important. Our potential home sales model measures what we believe a healthy market level of home sales should be based on the economic, demographic and housing market environments.
About the Potential Home Sales Model
Potential home sales measures existing-homes sales, which include single-family homes, townhomes, condominiums and co-ops on a seasonally adjusted annualized rate based on the historical relationship between existing-home sales and U.S. population demographic data, income and labor market conditions in the U.S. economy, price trends in the U.S. housing market, and conditions in the financial market. When the actual level of existing-home sales are significantly above potential home sales, the pace of turnover is not supported by market fundamentals and there is an increased likelihood of a market correction. Conversely, seasonally adjusted, annualized rates of actual existing-home sales below the level of potential existing-home sales indicate market turnover is underperforming the rate fundamentally supported by the current conditions. Actual seasonally adjusted annualized existing-home sales may exceed or fall short of the potential rate of sales for a variety of reasons, including non-traditional market conditions, policy constraints and market participant behavior. Recent potential home sale estimates are subject to revision in order to reflect the most up-to-date information available on the economy, housing market and financial conditions. The Potential Home Sales model is published prior to the National Association of Realtors’ Existing-Home Sales report each month.