A common adage about real estate is that it’s local. The dynamics of one housing market can be very different from another depending on the local economy and access to natural amenities, like mountains or water. The levels of loan application defect, fraud and misrepresentation risk vary greatly based on local conditions as well. In fact, substantial differences exist among the 100 markets that we track with the Loan Application Defect Index. For example, the riskiest market this month, Little Rock, Ark., is almost twice as risky as the safest market, Rochester, NY.
Defect risk levels can change dramatically over time as well. In the last three months, six markets experienced an increase in defect, fraud and misrepresentation risk of more than 10 percent, while three other markets experienced a decrease of more than 10 percent. The point is, just as real estate is driven by local market conditions, so is defect risk.
But, what are some of the conditions that tend to influence defect risk levels the most? The characteristics of the properties and loans involved in the real estate transactions in a given time period play an important role. Transactions involving condominiums tend to carry higher defect risk than transactions involving single-family homes. Traditionally, defect risk has been greater in purchase transactions than refinance transactions. Transactions involving second homes or investment properties tend to carry elevated levels of defect risk as well.
The Defect Index consistently identifies significant differences in risk in these areas. All else equal, a market with fewer refinance transactions, greater numbers of second home and investment property transactions and more multi-unit and condo property transactions will be riskier.
Nonetheless, measuring loan application defect, fraud and misrepresentation risk at the local level summarizes local differences into a single measure that can be consistently compared across markets. The map quickly shows where the differences between markets are greatest.
“There appears to be a high concentration of markets with elevated defect risk in the Sun Belt states and a high concentration of markets with lower defect risk in the Rust Belt states.”
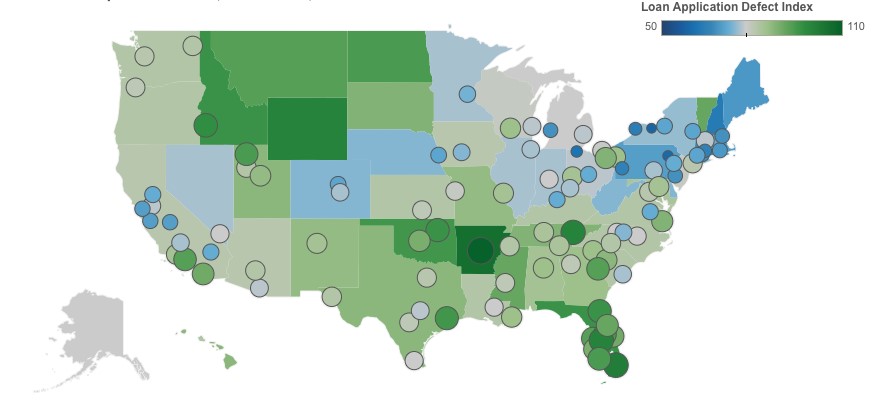
Defect Risk Dissipates in Rust Belt, Concentrates in Sun Belt
In March, the overall frequency of defects, fraudulence and misrepresentation in the information submitted in mortgage loan applications decreased by 1.2 percent compared with the previous month and increased by almost 4 percent compared with a year ago.
Interestingly, there appears to be a high concentration of markets with elevated defect risk in the Sun Belt states and a high concentration of markets with lower defect risk in the Rust Belt states. For example, Little Rock, Ark., Miami and Knoxville, Tenn. are currently the three riskiest markets in the country, while Rochester, NY, Scranton, Penn. and Toledo, Ohio are the least risky. How this geographic trend in defect risk changes in the next few months bears watching as we consider what risk factors may be at play in each market.
For Mark’s full analysis on loan defect risk, the top five states and markets with the greatest increases and decreases in defect risk, and more, please visit the Loan Application Defect Index.
The Defect Index is updated monthly with new data. Look for the next edition of the Defect Index the week of May 28, 2018.