Existing-homes sales are currently below expectations because it’s hard to be a buyer, if at first, you can’t be a seller. Nonetheless, the big increase in actual sales in March began to close the gap between actual existing-home sales and the market capacity for existing home sales.
Our Existing-Home Sales Capacity (EHS-C) model provides a gauge on whether existing-home sales, which include single-family homes, townhomes, condominiums and co-ops, are under capacity or over capacity based on current market fundamentals (current demographic, economic, price, and interest rate conditions). For example, seasonally adjusted, annualized rates of existing-home sales above the level of the EHS-C indicate market turnover is outperforming the rate fundamentally supported by the current conditions. Conversely, seasonally adjusted, annualized rates of existing-home sales below the level of the EHS-C indicate market turnover is underperforming the rate fundamentally supported by the current conditions.
The EHS-C increased by 1.3 percent (78,000 sales) in April compared to March and increased by 9.2 percent compared to April 2014. The seasonally adjusted, annualized rate for existing-home sales capacity is up 88.1 percent from the low point of sales reached in November 2011. The two largest contributors to the increase in the EHS-C model were house price growth (33,000) and improved economic conditions (28,000), and accounted for 78 percent of the change in the model. Growth in the population contributed modestly (1,000). A modest fall in interest rates added to the overall EHS-C increase by a little more than 16,000 sales.
The fact that actual existing-home sales volumes are lower than market capacity, yet house prices are increasing, indicates that the market is experiencing supply constraints more than demand constraints. While individual homeowner equity positions are improving, many homeowners still have a higher than market reservation price, or the price at which they are willing to put their home on the market for sale. Without the constraint of insufficient equity, many more homeowners would be willing to sell their homes, especially given the continued low interest rate environment and increased certainty in labor markets. Since the end of the recession in 2009, the market’s capacity to support sales activity has almost doubled, but is now significantly constrained by the pent-up supply.
Homeownership levels are the lowest they have been in a quarter century, and household formation growth has almost exclusively been in rental households for the last six years. Yet, this doesn’t necessarily mean that overall demand has fallen significantly. That’s because Millennials, the largest generation in sheer numbers, who have been the source of a lot of the recent rental household formation, are now entering their prime first-time home-buying years. This generation is even larger than the baby-boom generation that was the generational homeownership engine of the last 25 years.
The EHS-C will be published several days prior to National Association of Realtors Existing-Home Sales report each month.
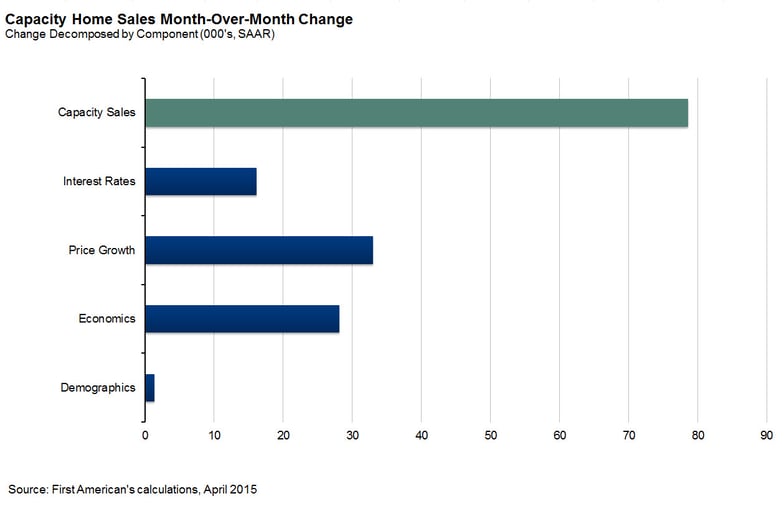
Chart: The Market Capacity for Existing Home Sales Month-Over-Month Change chart above provides an illustration of which current market fundamental components are having the most significant impact on the overall change in capacity for existing home sales. The current market fundamental components (blue bars) add up to the total change in sales capacity (green bar).