First American’s proprietary Potential Home Sales model examines December 2017 data and includes analysis from First American Chief Economist Mark Fleming on how the real estate market is performing versus its potential.
December 2017 Potential Home Sales
For the month of December, First American updated its proprietary Potential Home Sales model to show that:
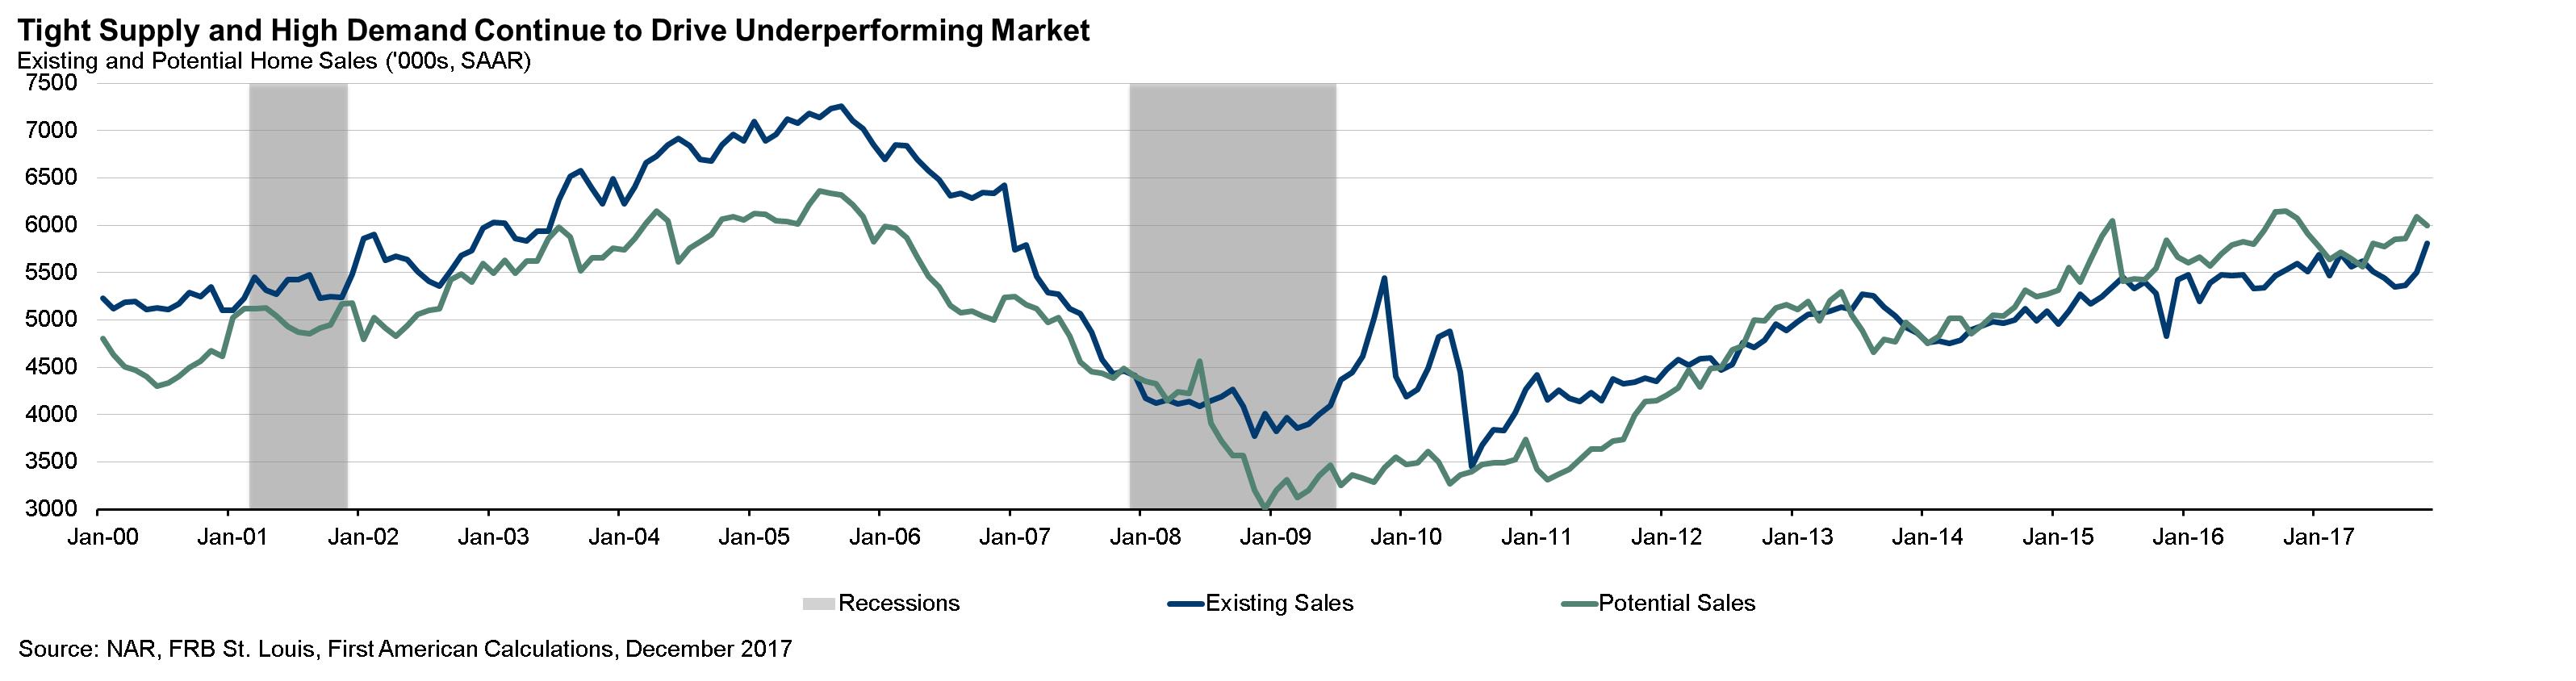
- Potential existing-home sales decreased to a 5.99 million seasonally adjusted annualized rate (SAAR), a 0.2 percent month-over-month decrease.
- This represents a 99.2 percent increase from the market potential low point reached in December 2008.
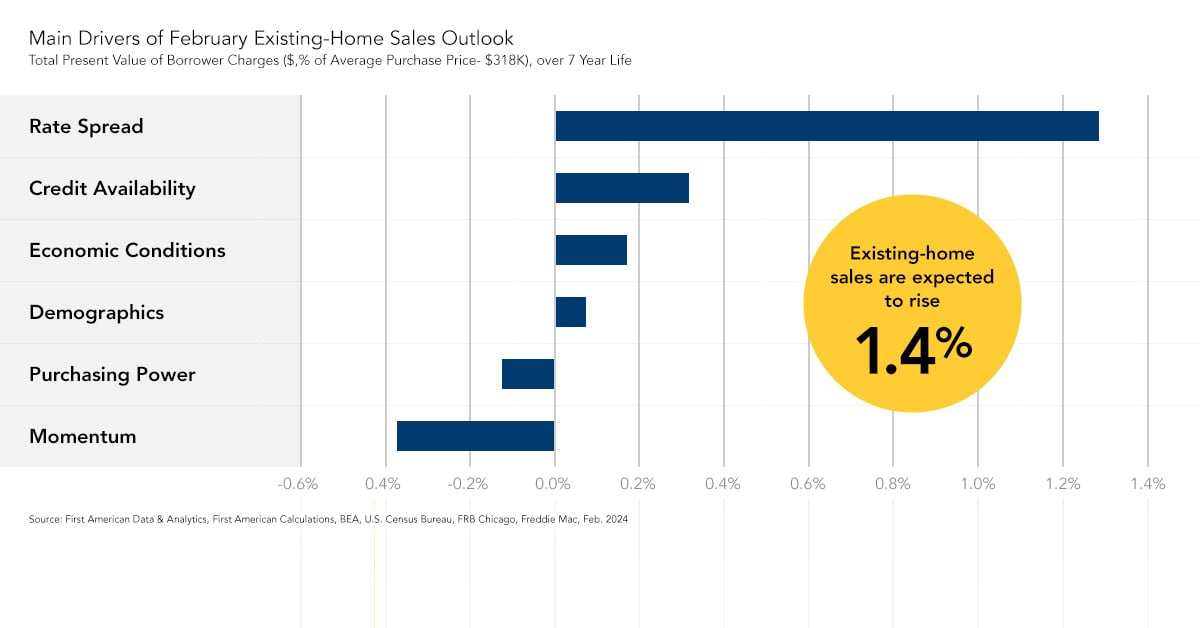
- The market potential for existing-home sales increased by 1.4 percent compared with a year ago, a gain of 82,000 (SAAR) sales.
- Currently, potential existing-home sales is 375,000 (SAAR), or 6.3 percent below the pre-recession peak of market potential, which occurred in July 2005.
Market Performance Gap
- The market for existing-home sales is underperforming its potential by 2.0 percent or an estimated 122,000 (SAAR) sales.
- Market potential decreased by an estimated 1,000 (SAAR) sales between November 2017 and December 2017.
"Sales have surged in recent months and significantly narrowed the gap between actual market performance and market potential."
Supply Shortage Still Sapping Market Potential
“Faster economic growth, a healthy stock market, low unemployment and low mortgage rates are fueling substantial home-buying demand. The pace of actual existing-home sales has surged in recent months and significantly narrowed the gap between actual market performance and market potential. Nonetheless, the market is still underperforming its potential. Existing-home sales have been restrained by an increasingly concerning shortage of properties for sale, which puts upward pressure on house prices,” said Mark Fleming, chief economist at First American. “The shortage of homes for sale will likely continue in 2018 and continue to push prices higher.”
Chief Economist Analysis Highlights
- The housing market’s potential for existing-home sales remained essentially unchanged between November 2017 and December 2017. The two main reasons for the lack of movement in market potential are the expectation for future supply also remained flat compared with November, as indicated by the rate of authorized building permits in the Census Bureau’s latest report, and mortgage rates remained below 4 percent for the seventh consecutive month. In other words, the housing supply shortage is unlikely to change, while home-buying demand, aided by low interest rates, remains strong.
- As millennial demand continues to strengthen in 2018, new homebuilding and sales listings for existing homes will struggle to keep up. The pace of new homebuilding faces headwinds. At the same time, the fear of not being able to find a home to buy is preventing homeowners from putting their homes on the market, as more homeowners are increasingly prisoners in their own homes.
- The supply of homes for sale nationally has fallen 9.0 percent from a year ago, and homes are selling 7.0 percent faster than a year ago, according to Realtor.com.
- The median number of days on market in December reached 83 days, and properties sold in six fewer days than this time last year – even as prices continued to climb year over year, according to Realtor.com.
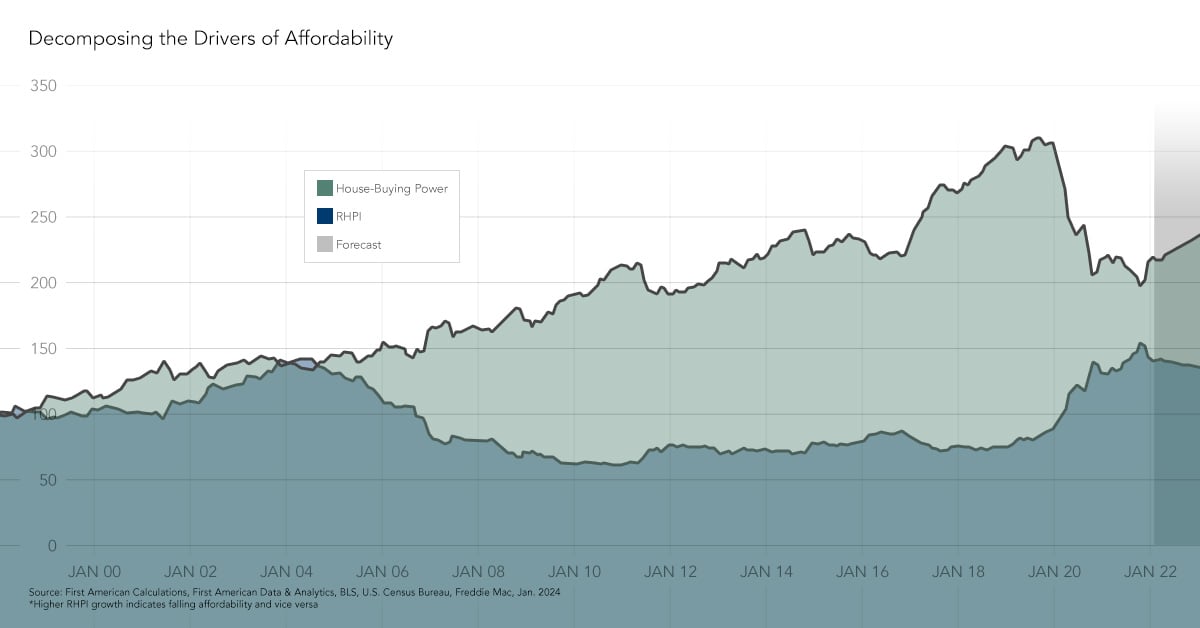
- As a result, according to the First American Real House Price Index, affordability is down 8.6 percent in November, compared with a year ago and declining in all markets tracked by First American.
What Insight Does the Potential Home Sales Model Reveal?
When considering the right time to buy or sell a home, an important factor in the decision should be the market’s overall health, which is largely a function of supply and demand. Knowing how close the market is to a healthy level of activity can help consumers determine if it is a good time to buy or sell, and what might happen to the market in the future. That is difficult to assess when looking at the number of homes sold at a particular point in time without understanding the health of the market at that time. Historical context is critically important. Our potential home sales model measures what we believe a healthy market level of home sales should be based on the economic, demographic and housing market environments.
About the Potential Home Sales Model
Potential home sales measures existing-homes sales, which include single-family homes, townhomes, condominiums and co-ops on a seasonally adjusted annualized rate based on the historical relationship between existing-home sales and U.S. population demographic data, income and labor market conditions in the U.S. economy, price trends in the U.S. housing market, and conditions in the financial market. When the actual level of existing-home sales are significantly above potential home sales, the pace of turnover is not supported by market fundamentals and there is an increased likelihood of a market correction. Conversely, seasonally adjusted, annualized rates of actual existing-home sales below the level of potential existing-home sales indicate market turnover is underperforming the rate fundamentally supported by the current conditions. Actual seasonally adjusted annualized existing-home sales may exceed or fall short of the potential rate of sales for a variety of reasons, including non-traditional market conditions, policy constraints and market participant behavior. Recent potential home sale estimates are subject to revision in order to reflect the most up-to-date information available on the economy, housing market and financial conditions. The Potential Home Sales model is published prior to the National Association of Realtors’ Existing-Home Sales report each month.