
Real estate cycles are generally created by movements in demand not supply. While it is important to track commercial real estate performance through various cycles and divergent trends, patterns of performance are impacted not just by supply and demand, but as much by the quality of assets and portfolios. And is risk a factor? Do investors focus on volatility relative to how their CRE portfolios have performed over time? Do they view their exposure to a particular sector, asset class or region, measuring risk given a certain probability on a current basis or historically?
CPPI™ the Commercial Property Pricing Index, has historically proven to be a leading indicator of cyclical trends in the real estate sector, as evidenced in prior cycles. It is interesting to note that while CRE pricing is at an all-time high, volatility in the financial markets is relatively low.
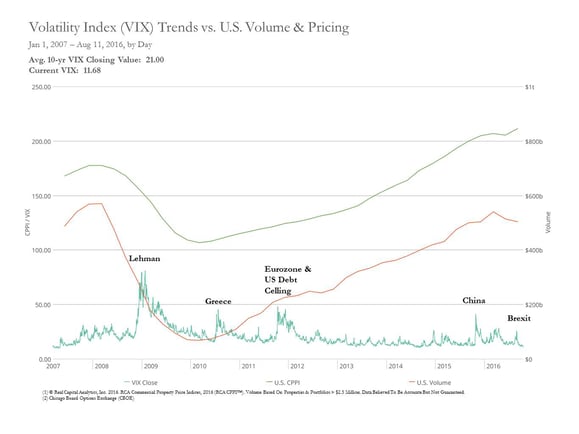
Prices reflect the tension of supply and demand in a market but are not necessarily a measure of volatility. Change in pricing may be a better metric. US CPPI peaked at 177.6 in Q4,2007 pre-Lehman, and at its trough in Q4,2009, fell to 106.9 post-Lehman, a precipitous drop of 40%. Market downturns can provide some of the most opportunistic ways to drive investment performance, as we have seen when assets have pricing corrections. From 2000, when the Index first began, pricing has consistently risen, and today it is at an estimated benchmark of 211.5 as of June, 2016 (published quarterly).
A key measure of implied volatility is based on the S&P500, perhaps known to many as the “fear gauge”, or VIX, created by the Chicago Board Options Exchange (CBOE). The VIX is a popular measure of the expected range of stock volatility over a period of time, and represents a confidence interval of 68%. Therefore, the following sentence is how it should be interpreted; If the VIX is 15, there is a 68% chance the S&P500 will increase or decrease by 15% or less over the next year. VIX lower than 20 indicates “calm market expectations”, while VIX above 30 signals “high uncertainty”. And no surprise, VIX reached a whopping 80.86, its all-time-high in 2008. Currently VIX is hovering at 11.68 which is lower than its last ten-year average 21.00. While it appears we are in a “calm market”, this could change at any moment, especially during political or economic crises.
So what, if any correlation can be made between VIX, S&P500 returns & commercial real estate returns? Turns out, these have a low correlation, with the exception of volatility at the time of the Lehman crash, which impacted CRE volume and pricing. CPPI™ still outperformed the S&P500 during the months of 2008 and 2009. As seen in the annotated chart, the events of Greece, 2010, Eurozone & Debt Ceiling, 2011, China Currency Devaluation, 2015 and now Brexit, 2016 have all had little to no impact on pricing in the commercial real estate markets. This proves CRE remains a solid alternative investment, and can hedge risk in the equity markets. It becomes even a more stable investment as market uncertainty increases. While financial market and currency fluctuations are affected by volatility, real estate investments have out-performed equities for the past 6 years on a global basis and have remained steady.
Despite declining commercial real estate volume today, asset prices remain resilient. Global players endure, and real estate continues to play and important part of multi-asset-class-portfolios.
Check out more articles by Linda Isaacson on our website.
